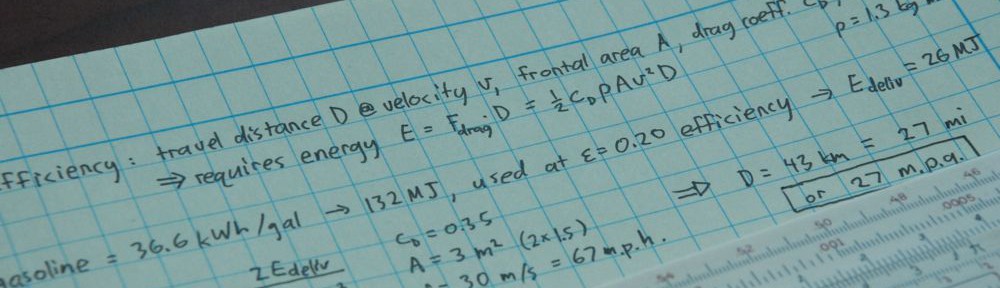
[An updated treatment of some of this material appears in Chapters 12 and 13 of the Energy and Human Ambitions on a Finite Planet (free) textbook.]
For me, the most delightful turn of events in the ultimate nerd-song “Particle Man” by They Might Be Giants, is that after introducing (in order of complexity) particle-man, triangle-man, universe-man, and person-man—and learning that triangle-man naturally beats particle-man in a match up—we pit person-man against triangle-man to discover that triangle wins—again. In this post, we’ll pit solar against wind and see who wins.
 I will take my usual approach and estimate what I can—as opposed to researching the results of detailed studies. It’s part of the process of personal mastery of the big-picture issues, while also providing a sanity-check. In exploring useful reactions to the looming peak oil crisis (or pick your favorite rationale for weaning ourselves from fossil fuels), an appropriate strategy is to assess ballpark capacities of the various options. Some will prove to be orders-of-magnitude more prodigious than we need, others will be marginal, and many will show themselves to be woefully inadequate to match the required scale. So the goal is to perform this crude sorting process into abundant, useful, and waste of time.
Earth’s Energy Budget
Since many of the options I will discuss in the coming weeks ultimately derive from the Sun, it is useful to throw up an energy budget.
 Of the 1370 W/m² incident on the upper atmosphere from the Sun, 30% is reflected straight away without pausing long enough to say hello. About 20% is absorbed in the atmosphere and clouds, and 50% gets absorbed at ground level. Note that 7% of the energy budget goes into conduction and rising air (separate phenomena; the latter relating to wind). Virtually no heat is able to conduct through the thick atmosphere, so really this figure is all about convection, or moving air.
For comparison, the energy consumption (conversion) rate of the human race is about 13 TW (13 trillion Watts), which works out to an average of about 2,000 W per person on the globe (Americans are 10 kW). We can also divide by the area of the globe to get a power density of 0.025 W per square meter, or 0.09 W/m² if we just count land area.
Solar Potential
If 50% of the incoming solar radiation makes its way to the ground, then we have about 700 W/m² for the average terrestrial square meter facing the Sun. But the Sun puts this onto the projected πR² area of the Earth (the disk of the Earth as seen from the Sun), while the actual 3-D globe has an area of 4πR². So we must divide by four to get the flux per unit area of actual terra firma, yielding 170 W/m². We can think of this factor of four as being made up of a factor of two for day and night, plus a factor of two because the Sun is not overhead all the time, resulting in a loss of intensity per square meter at the ground.
A panel tilted to the site latitude can compensate for some of the slanted-sun-angle loss (for high latitudes, the ground always suffers from this geometric dilution, even at “high” noon), so that the ½ factor becomes 2/π, or 0.64, representing a global 30% boost over horizontal panels. In this scheme, we get 220 W/m² for our latitude-tilted panel (nearly independent of latitude, weather notwithstanding). The tilted panels will require more land to avoid self-shadowing, so that the amount of land area needed is stuck with the pre-adjusted value of 170 W/m².
Note how much bigger the solar potential is than our demand of 0.09 W/m² of land area. This implies that we need only 0.05% of the land to capture adequate sunlight, or that enough sunlight strikes land (the entire Earth) in 4.5 hours (1.25 hours) to satisfy our needs for a year. That’s a powerful resource!
But once we factor in efficiency—say 10% for simplicity and conservatism—we need ten times the land area computed above. Still, it’s a pittance. I have used the following graphic before to illustrate how much land would be occupied by solar photovoltaics (PV) at 8% efficiency to produce 18 TW of electrical output (note that about half of the 13 TW consumption today is lost in heat engines, so 18 TW of electricity more than satisfies our current demand).

The land area needed to produce 18 terawatts (50% larger than 2010 value) using 8% efficient photovoltaics, shown as black dots.
I’ll put solar in the “abundant” box.
Capturing Sun
Catching energy from the Sun is pretty simple. Sit in the sun on a cool day and benefit from its warmth. Situate your house so that south-facing windows can swallow sunlight and offset (or obviate) conventional sources of heat. Use thermal collectors for domestic hot water and/or interior heating. Stick a PV panel outside and it will generate electricity provided it is not placed face-down. Concentrate sunlight to heat a fluid and/or create steam for electricity production in a heat engine (possibly combined with thermal storage). Lots of options, when the sun shines.
Many react to my solar enthusiasm by pointing out that San Diego is an exceptional place for solar—so no wonder I’m enamored. But San Diego is only 19% better than a typical location in the lower-48 states (we get a lot of marine-layer clouds: May Gray is followed by June Gloom, and sometimes July Nebulae—okay, the last rhyme is my own Latin-nerd invention, so groans excused).
The National Renewable Energy Lab (NREL) performed a 30-year study of insolation for 239 sites in the U.S. (data here), out of which one can see that the worst study location in the lower-48 (Quillayute, WA on the Olympic Peninsula) is only a factor of two worse than the best study location (Dagget, CA in the Mojave Desert). It turns out that St. Louis, Missouri wins the prize for most typical solar location, based on a variety of measures. It gets an annual average of 4.8 kWh/m²/day (which, conveniently, is equivalent to 4.8 hours of full, direct sun each day, since the full, direct sun delivers approximately 1 kW/m² of power). Divide this number by 24 to get kW/m² for comparison with our previous assessments: 200 W/m² for St. Louis.
A table comparing the worst, typical, and best sites in the U.S. provides some useful numbers to chew on. For each location, three modes are considered: flat panel tilted at latitude (typical PV); flat panel with 2-axis tracking of the Sun; and concentration requiring 2-axis tracking and direct sun (e.g., for solar thermal, which is intolerant of clouds). For each mode, three daily-average numbers are given: worst month—yearly average—best month. Values are in kWh/m²/day, and averaged over the 30-year data span. Yearly variation is detailed in the raw data. Think of the numbers as equivalent full-sun hours per day.
| Location | Fixed Tilt | 2-axis Tracking | Concentration |
| Dagget, CA | 5.2—6.6—7.4 | 6.8—9.4—12.0 | 5.4—7.5—9.7 |
| San Diego, CA | 4.6—5.7—6.5 | 5.9—7.4—8.9 | 4.5—5.3—6.3 |
| St. Louis, MO | 3.1—4.8—5.9 | 3.7—6.3—8.5 | 2.4—4.1—5.5 |
| Quillayute, WA | 1.5—3.4—4.8 | 1.7—4.4—6.8 | 1.0—2.6—4.0 |
| Fairbanks, AK | 0.3—3.3—5.6 | 0.3—4.7—8.7 | 0.3—2.9—5.3 |
I threw in San Diego, California and Fairbanks, Alaska for reference. I could devote a whole post to chewing on these results and what they tell us. I won’t, but I can’t help pointing out that Fairbanks—at 65° latitude—is competitive with Quillayute, and on an annual average basis gathers 50% as much energy as the smokin’ California desert! Yes, December is bleak, and seasonal storage is very tough. But still, I’m impressed.
Wind Potential
Wind represents a secondary solar energy flow, coming from differential solar heating of the land and from convection induced by temperature gradients in the atmosphere (hot below, cool on top). Wind is therefore like solar crumbs on the table and is destined to be a small fraction of the direct solar potential. How much would you guess? 1%, 5%, 10%? What handles might we put on it as an estimate?
One approach is to note that convection is a thermal process driven by the temperature difference between the warm surface and the cool heights. The maximum thermodynamic efficiency for producing mechanical energy out of a thermal system (we call this a heat engine) is (Th − Tc)/Th, where subscripts denote the hot and cold limits, expressed in Kelvin. The troposphere—from the ground up to about 10 km, where weather lives—has an average surface temperature of about 290 K and tropopause temperature of about 230 K, leading to a maximum efficiency of 20%. But now we get to chop this down according to the notions that about half of the cooling in the atmosphere is via direct radiation and not convection, that a fraction of the total convective energy will manifest itself in horizontal winds, and that there will also be viscous losses turning the kinetic energy of wind back to heat in the atmosphere. So I end up estimating that less than 5% of the thermal energy deposited by the Sun ends up driving horizontal winds.
Another handle we might try is to guess that a typical wind speed in the troposphere is 20 m/s (44 m.p.h.), and note that each square meter of land has 104 kg sitting on top of it (leading to mg = 105 N/m² of pressure, or 14 pounds per square inch). So the kinetic energy in the air is ½mv² = 2 MJ over each square meter. Now comes the tricky part. If we instantly sapped all that energy from the air, how long would it take to re-establish the full flow as if nothing had happened? I’m going to say one day, or 86,400 seconds. I am simultaneously tempted to go longer and shorter. Neurosis can be the sign of a decent guess. This translates to a power density of about 25 W/m², which is about 7% of total solar input. Not bad for ballpark. Noting that the energy budget graphic above puts rising air at 7% of the total solar budget, we might guess 5% in horizontal winds as an upper bound. This gives 17 W/m², an order of magnitude less than sunlight available at the surface. Ah—but how much of this wind energy is available at the surface?
Capturing Wind
Catching the wind can be a subtle enterprise. Greed is punished. By robbing all the kinetic energy out of an oncoming wind, the air must necessarily stop, so that the oncoming airflow diverts around the obstacle. Theoretically, an isolated windmill could capture 59% of the kinetic energy incident on the rotor area before becoming self-limited (called the Betz limit). Engineering practicalities impose further limitations, so that the best windmills today achieve 40–50% total efficiency.
How much power will a windmill generate? If the air velocity is v, each second of time delivers a tube of air with volume Av, where A is the area of the rotor (πD²/4, if D is the rotor diameter). The mass of air incident on the windmill each second is then ρAv, where ρ ≈ 1.2 kg/m³ is the density of air. The kinetic energy available per second, or power, is therefore P = ½ρAv³. Then we’d multiply this by the net efficiency (<50%) to get power delivered. Note the cubic dependence on velocity. This is a big deal. Cut the wind in half and suffer a factor of eight less available power. The largest wind turbines in the world now have a rotor diameter of 126 m and generate up to 7.6 MW (which I calculate corresponds to v = 13 m/s, or 29 m.p.h.). Windmills usually self-limit at higher wind velocities or else risk literally being blown to pieces.
Assuming that our windmills could lay claim only to the lower 150 m of the atmosphere, we access 180 kg/m² of air above the ground, which is 1.8% of the total we used to drive our calculations. This turns our 17 W/m² into 0.31 W/m². Factoring in efficiency of collection, I get 0.15 W/m², which is marginally larger than our land-based need. And I must bear in mind that I considered 5% to be an upper-bound estimate of the fraction of solar input energy converted to horizontal wind. And I have not addressed the fact that wind near the surface is lighter than winds aloft. On the other hand, winds are not strictly stratified, so that new energy can enter from above, extending our reach above the 150 m limit I used.
On balance, wind certainly goes into the “useful” box. But considering practicalities, wind may not be capable of satisfying our total demand the way solar so easily can, even if deployed across 100% of the land area.
Solar and Wind Have a Fight
Who wins? It depends on what you value most. If it’s installed capacity, wind smokes solar. If it’s total available resource, solar wins hands-down. Economically, wind comes in cheaper per peak Watt or per kWh produced, so it wins this contest. Small scale (home) installations: solar takes it. Night-time: advantage wind. Intermittency: both lose (though often in complementary ways).
When I first started educating myself about alternative energies, I kept seeing plots of solar potential (insolation) and wind potential in units of W/m². Wind looked far better than solar. For instance, the solar map for annual insolation in the U.S. looks like:

Annual insolation. Multiply values by 1000 and divide by 24 to get units of W/m².
Here, the values are given in kWh/m²/day, so to get W/m², just multiply by 1000 and divide by 24. For instance, the bright yellow covering Missouri is 4.5–5.0 kWh/m²/day, or 188–208 W/m². The steps are in increments of 0.5 kWh/m²/day, or about 20 W/m². This puts the most orange regions in the desert southwest at 271 292 W/m².
Meanwhile, the map for wind for sites deemed to be worth development looks like:
 Note that the best sites exceed 800 W/m², and large land areas approach 500 W/m². On the face of it, this looks far better than solar. But beware: the area in the denominator for wind power density is the area of the rotor—not the land area as is effectively the case for the solar map (panel tilt amounts to a 15% boost at 30° latitude, 41% boost at 45°).
A rule of thumb for a field of windmills is that they should not be closer than 5 rotor diameters side-by-side (relative to wind direction) and 10 rotor diameters in the wind direction (some use >4 and >7, respectively). Otherwise one windmill blocks the next, bogging down the wind and diverting the flow around the hindrance. The result is that each windmill stakes out a land area 50 square rotor diameters, while the rotor itself is π/4 square rotor diameters. The rotors therefore occupy only 1.6% of the land area, so that the raging 800 W/m² by rotor area becomes 13 W/m² by land area, and the inland hotspots become 8 W/m².
The upshot is that a 1 m² patch of flat land in the Texas panhandle might get 200 W of average sunlight (downward corrected for latitude tilt), compared to 8 W of wind power. If we convert sunlight to electricity at 15% efficiency, and wind at 45% efficiency (typical numbers), we have 30 W vs. 3.5 W. Solar beats wind (in that same location) by an order of magnitude. Comparing optimal solar sites to optimal wind sites (taking 1000 W/m² by rotor area), solar wins by a factor of five.
As a side exploration, if I look at the wind picture above, and use Lake Michigan as a reference area for water and Nebraska as a typical area for a state (at 60,000 km² and 200,000 km², respectively), I count about 8 lakes’-worth of offshore red, one lake’s-worth of offshore blue, and about 7 more of orange-to pink. Add to this 8 states’-worth of orange-pink on land and we have 13 TW of offshore wind potential and 4.5 TW of land-based potential represented in the graphic (while using 3 TW). My earlier estimate of 0.15 W/m² of wind potential, when multiplied by the area of the lower-48 states gives about 1.2 TW. I am left to puzzle over the disparity. My estimate is capped by the 7% of energy allocated to moving air in the solar energy budget, so either the estimates based on the map are wildly optimistic (e.g., the power density is based on isolated windmills, while full-scale deployment may create enough friction to substantially alter wind patterns; and/or because I did not apply efficiency factors), or my restriction of using the bottom 150 m of atmosphere neglected possible energy replenishment from vertical currents. See the Appendix for comparison to studies and some insight into the mismatch.
Triangle Wins
Solar and Wind have been vying for purchase in the energy game for many years now. Who is winning? Fossil fuels: they still beat the pants off either one. That’s our triangle. Fossil fuels are cheap and reliable and are their own storage and allow transportation by car, truck, ship, airplane, and fit seamlessly into our current infrastructure. Wind—and especially solar—don’t generally compete price-wise. Both are intermittent, so that they won’t fit into our current infrastructure at a large scale, requiring substantial storage and transmission in order to become major providers of energy. Neither one really helps with the liquid fuels crunch we will experience in the oil decline phase. Electric cars are unlikely to penetrate the market quickly and cheaply enough to avert hardship.
Don’t get me wrong. I am a huge fan of both forms of energy production—especially solar. I’m swayed by the raw numbers solar has on its side. I have a home-built stand-alone PV system and golf-cart batteries that provides most of my electricity (as a hobby with benefits). I am delighted by the fact that wind now generates about 1% of the electricity in the U.S. for prices that are not terribly greater than for conventional power. I personally think that we should get over our gripes about these things being more expensive than our old friends, and embrace them full-scale—dealing with the costs, intermittency, storage issues, transmission build-up, together with a reduction in our total demand.
I know these things are possible, and that we have in the Sun and wind resources that can satisfy our (hopefully reduced) needs from a physical point of view. But the idea that people would voluntarily commit to this more expensive course of action in a timely manner seems to be pure fantasy. Only rising energy costs will drive us. And we risk waiting too late. And we find ourselves in The Energy Trap. And we learn that everything gets more expensive when energy prices soar—even the renewables that are supposed to be the escape route. Our indebted economy and polarized political system crack under the stress. Substitutes do not sweep in to save the day. Person-man meets Energy-man. They have a fight, triangle wins. Triangle-Man.
Appendix
As part of an undergraduate research project, Thomas Tu sifted through credible assessments of wind potential for comparison to my estimations. For context, my endpoint estimate was 0.15 W/m², which translates to about 21 TW if 100% of Earth’s land area were to be developed. We consume about 13 TW globally, and have 0.045 TW of wind power installed.
Among the finds was a gem of a paper by Carlos de Castro et al., winning my Most Valuable Paper award for several reasons. First, it summarizes estimates of global wind potential from a variety of sources. Second, it follows a top-down approach much like I did here (starting with the total energy budget available). Third, it points out that many bottom-up estimates (starting with the output of a wind farm and scaling up) violate energy conservation by ending up with more energy than is available in the system. The full PDF is access-restricted, but the basic points are summarized in a post on the Oil Drum.
As summarized in the paper, estimates of global potential range from 1 TW to 80 TW. Assessments of economic viability tend to put us at no more than 5 TW by 2050, and the ultimately sustainable wind potential is estimated at about 7 TW. One important thing to note is that estimates vary by a lot—meaning that we are not yet sure whether wind can fill a substantial part of our current demand.
What I found especially useful about the de Castro et al. approach was a set of numerical values for the total power dissipated by wind in the troposphere (these numbers range from 340–3600 TW, again covering a wide range). They pick 1200 TW as the most physically realistic. The next step is to estimate how much energy is available in the lowest 200 m, which they approach by three independent methods, all pointing to about 100 TW. Note that this is about four times larger than the strict proportional amount (200 m out of 10 km would yield 2% of 1200 TW, or 24 TW). So in effect, this contains the energy replenishment I suspected I missed: dissipation of wind energy takes place disproportionately near the ground. Applied to usable land (avoid ice sheets, etc.), we have 20 TW available worldwide. They proceed to apply various practical efficiency constraints—many of which I left out of my analysis. These factors are summarized in the Oil Drum article—ending up with an estimate for global potential of about 1 TW.
Even if this estimate is an order-of-magnitude too pessimistic (though I resonate with their top-down common-sense approach), the result is the same: wind deserves a place in the “useful” box, but it does not have the numbers behind it to make it an over-abundant resource like the Sun.
Hits: 3558
So Fossil fuels still beat the pants off of solar or wind. Why not use Wind or Solar to produce liquid fuels? Several methods are possible, syngas to methanol or nitrogen to ammonia.
I am ok with living next to a solar or geothermal or even nuclear plant, but don’t try
putting up a big wind turbine in my neighbourhood – I would protest the noise and
view disruption.
Renewable->liquid fuels just doesn’t get round the problem, apart from the storage one, but whats the round trip efficiency of these processes? The best might appear to be algae since the conversion on solar energy to liquid fuel is reasonably direct though the efficiency is of order 1%, much poorer than a PV panels 15% or so. It always better to use the energy in the form you get it.
Personally I was quite dissapointed when a wind turbine wasn’t built near my house, I think the noise issue is over-rated. I’ve stood beneath very large turbines, even then you could easily hold a conversation.
I find wind farms to be nightmarish eyesores on the landscape. And can we ‘do the math’ on the energy cost of maintaining such an army of gigantic propellers?
Windmills are a lot of mechanics and parts. Parts break and wear and need fixin. PV are solid state and only get damaged when “attacked” externally, as all things do.
I think the best way forward is to have nuclear (Type IV, Breeder) power as a base source on a shared grid. With distributed PV on roof tops of homes/businesses that gets used at source or sold back to grid.
Distributed-Location solar thermal and PV (a combination of individual to community scale systems) – if installed before some political event disrupts the global triangle energy flow, or the credit markets and finances freeze over, or both – might preserve a comfortable standard of living in areas where basic nutrition and other resources remain locally available. The chances that our mass “developed” civilization, made possible entirely by “cheap and reliable and are their own storage and allow transportation by car, truck, ship, airplane” fossil fuels – just as life as we know it was made possible by the geometry and physics of the Earth’s orbit relative to the Sun’s radiation – will survive a transition from the womb in which it was evolved, however, are a topic that physics has a tough time quantifying. Even the pseudoscience of economics, with its magic variables and imaginary constants and such, hasn’t seemed to have much luck so far.
Of course, that same patch of Texas panhandle can support *both* wind turbines and solar panels.
Or, much more likely, farmers will plant turbines amongst their crops.
Solar panels are great for shading things. If you were already going to be shading said thing, solar is fantastic — put solar on roofs, or put solar panels on land that is somehow more productive when shaded, or at worst on land that you don’t care if it gets shaded at all.
We have vast tracts of land that most emphatically cannot get shaded — specifically, cropland. But that same land can still harvest a fair amount of solar energy in the form of wind, while still being just as productive as cropland.
My guess is that that’s the only way we’ll ever see significant inland wind farms — when they share the acreage with farmland. And we’ll replace offshore oil rigs with offshore wind farms. Aside from that, I don’t expect we’ll see significant wind installations.
Cheers,
b&
Seems that turbines on farmland would help reduce wind speed a little also which will be good for the crops.
Certainly the US land dedicated today to corn *ethanol* could be rededicated and ‘shaded’, i.e. covered over with PV. That area is apparently ~150,000 km² (40% of all corn), so at 40W/m² average electric output we have near 6TW average, enough to replace all US fossil fuel use – electric generation, transportation, and heating – assuming everything is converted to electric source. Then there’s storage …
People always complain about the noise of wind turbines, but they love their freeways. They don’t love living next to one, but they like having them to drive on.
The Energy Trap will overshadow everything else, squeezing ever tighter as we descend from Hubbert’s peak/plateau. Nevertheless analyses such as these might – just might – help to make a somewhat better use of the shrinking resources in the world past Peak Everything. Thank you!
Hubbert’s plateau? If there’s a long plateau then the trap disappears.
A) don’t believe Yergin and company that the current plateau will be a long-lived phenomenon.
B) Even so, I think it is (unfortunately) unlikely that we will experience the collective motivation necessary to pursue full-scale fossil fuel replacement until we see a decline from the plateau, in which case the Energy Trap still applies. I’d love to be proven wrong here (to see us develop alternatives in an Apollo-style program as if nothing else matters), but I don’t always get what I want.
Regarding plateaus, I note that Texas production is up a very un-Hubert like 50% from it’s 2005 low.
http://www.eia.gov/dnav/pet/hist/LeafHandler.ashx?n=PET&s=MCRFPTX2&f=M
Decline must inevitable come, but it is the *meanwhile* that is interesting, as meanwhile the alternatives continue to improve. Solar, wind, geothermal, bio-fuels, tidal, storage and especially demand side conservation all continue to improve per unit power or per unit energy produced/saved, meaning their EROEI also generally improve. Even nuclear’s future is looking better via small modular and safer, high-burn up fertile fuel designs (looking forward to that post). This means that come the decline, alternatives be deployed faster per unit which works against the trap. Every percentage point increase in current renewable deployment *now* works against the trap.
Though urgency may be warranted, I doubt Apollo or Manhattan like projects are the right approach. Apollo enabled three guys to do some extraordinary things. By contrast what’s needed now is to enable millions to use (thus afford) sustainable amounts of energy. Against the current steady, broad, but relatively slow progress, consider a theoretical crash energy program instituted, say, 15 years ago. At that time wind would have been the overwhelming favorite, following the early and problematic designs deployed in Denmark and California. Am all-in, crash program to build wind then would have a) cost several times per unit output what wind does now, b) made a commitment to an installation of 1995 (improved by more money) wind tech, delaying deployed updates 10-20 years, c) frozen major improvement in other technologies once vast sums of government money focused only on wind (the Betamax phenomenon). As a consequence much of the near 20 fold improvement in solar energy cost since than time is at least delayed (See for example E. Sachs solar history: http://thinkprogress.org/wp-content/uploads/2011/07/photovoltaic-cost.jpg)
The first point is much like the climate change deniers pointing to a small chunk of data to make a narrow point not supported by the big picture. Texas oil on the longer view is obviously well past peak, and does not bolster a plateau viewpoint.
The plan of just waiting for improvements to get us out of a fix feels to me like a boiling frog plan. It carries substantial risk. My instinct is to act on things we can control, and not assume the raft will float where we want it to go on its own. Faith is not enough for me.
But this discussion is veering off topic a bit, so I’ll discontinue here.
There’s an interesting real-world example of this unfolding in Ontario right now. Essentially the provincial government offered subsidies to make solar panels far more economically viable, which I see as a very good thing in the long term (http://www.theglobeandmail.com/report-on-business/industry-news/energy-and-resources/solar-sector-must-develop-business-like-strategy-ottawa-says/article2260814/). We need to be heavily investing in alternatives while we have the spare resources to do so, for anything that is built now will help to soften the landing from the energy consumption frenzy we are in the midst of. Obviously solar energy isn’t going to be a direct replacement for gasoline, but there are indirect methods that will still allow our society to function. For example, we could drastically cut our oil consumption if all office workers stopped commuting to work and instead telecommuted from home. They would still require electricity to power their computers and whatnot, but would allow the gas and oil to be rationed for more crucial purposes, i.e. food production. It’s not going to be pretty though.
Hello,
I’ve done some similar calculations estimating how much land area would be needed to provide x amount of GW/TW electrical capacity from solar panels . I calculated based on just pure solar panel area alone. Then I realized, of course – that solar power stations usually have a significant amount of space between panel arrays to prevent shadowing and to allow access for repair – in addition to that, solar power stations need a considerable amount of additional low-voltage wiring and high-voltage lines and transformer step up sub-stations compared to coal/nat-gas power stations.
For a given surface area of solar panels – about 3-4 times as much real surface area is needed between panels to prevent self-shadowing and allow access for repairs and road access. Wind turbines also need road access.
My own calculations yielded areas of land in the region of around 2 million square kilometers to provide around 10 TW of electrical capacity. This is based on a peak solar insolation of 1000 W/m^2, and a factor of 4 for the solar day and using 10% efficient solar panels . This value doesn’t include land area for power line corridors and distribution lines and step-up and step-down transformers, as well as the massive amount of additional end -point wiring or for the resources needed to manufacture all that (additional metal and concrete resources) (!). Roughly speaking, I would estimate a land area at least half again as large for resource extraction, for an additional 1 million square kilometers.
Doable I suppose, but the environmental effects of using another 2.2% of land surface area in a massive terraforming project must be considerable. The largest problem is actually getting a hold of large chunks of land for such projects.
Tom, I enjoy your realistic analysis. For a real time analysis of an actual country wide system have a look at –
https://demanda.ree.es/demandaGeneracionAreasEng.html
This is a Spanish electrical distribution network official site. From this graph the generation mix of wind, nuclear etc are clearly visible. Today about 10% of Spain´s electricity is coming from wind, however look back to November and at times 50% was coming from the wind. Of interest is the increasing input of solar (part of Special Regime) which broadly matches peak power consumption. Also of interest is the hydro electric / hydro storage section, which provides the variable output / storage to maximize renewable production. Over the last few years the contribution by coal has gradually dropped and coal fired output has become more flexible at shorter time scales.
Ooops! I meant to say that solar output broadly matches peak daily power requirements in timing, not in it´s ability to meet the actual power required; give it time though……………
The main problem with wind power is that there will always be a need to have backup power if there is no wind. This can be handled either with extra powerlines to carry power from elsewhere or local generators (conventional or nuclear) That has to be factored into the cost. Factoring in the windless days by reducing the efficiency addresses only part of the issue with wind. It can contribute probably up to 5% of baseload needs, any more and you run into the standby problem again. see also http://www.clepair.net/windSchiphol.html
Low wind and cloudy days are really only a problem at local scales, not regional scales. The wind is always blowing somewhere, and the sun is always shining somewhere.
We’re going to need a smart grid no matter what. Once we have one, concerns about cloudy, no-wind days basically vanish. The rare “perfect storm” types of situations will easily be handled by the exact same means we currently handle spikes in demand — with high-cost standby generation facilities.
Besides. Even today we’re not immune from blackouts and brownouts. Why should we let the perfect be the enemy of the better? Especially since what we have today is increasingly going to get expensive, and eventually itself unreliable due to financial reasons?
Cheers,
b&
Perhaps I’m biased, working for an energy storage company, but I don’t agree. There was some really good work done by Pöyry that looked at the level of intermittency in the European energy supply that would exist in 2050 for various renewable rollout scenarios using real-life weather data from this decade. The result showed very significant variation even from a wide area perspective – so even ignoring transmission capacity constraints etc the ‘sun is always shining/wind is always blowing somewhere’ mantra is more based on faith than fact.
However, I totally agree that the perfect is the enemy of the good in many of these ‘scenarios’; particularly Tom your sizing of storage for 7 days energy demand is just meaningless – it would never make sense economically to do anything like this given the infrequency of such an event. Proving that it’s ridiculous doesn’t really do anything to advance the argument.
The problem with standby generation assets is that they’re expensive to build, and they become a lot more expensive to operate the smaller the operating period as you have to amortize the construction and O&M costs over a smaller total number of kWh.
So the answer is to have reserve capacity where the vast bulk of total cost is simply fuel cost – like gas heaters/coolers. Cheap storage, and cheap infrastructure. The inefficiency of energy conversion to get the gas from renewable sources matters a lot less if it’s only needed in small quantities (and here I’m emphatically NOT biased as my own company focusses on electrical storage anyway). As you also observe there is the potential to do quite a bit with ‘smart’ (or, at least, ‘not extremely stupid’) generation scheduling, but it’s not a cure all.
Basically I think that installed capacity is going to be a much bigger problem for renewables than intermittency once they arrive. We have solutions that can manage intermittency becoming available at increasingly reasonable cost, they’re already able to be deployed (in volume, without flooding entire states) in a highly scalable way.
The problem is that we, globally, are burning more coal than ever, and preparing to burn even more gas. Rather than flawed analysis that says there isn’t enough STORAGE in the grid to manage renewable intermittency issues which aren’t yet remotely limiting deployment. The problems that have occured in Germany on sunny days with ‘too much solar’ are a matter of ‘dumb’ inverter design – not too much energy. I will be more than happy to see a surplus of solar power in the grid as I *know* that economic options are available to address it… but that situation is a long way away!
The issue of back up power is often floated as an additional cost. We are adding wind power to already existing systems which are already supporting peak loads, not building entire systems from scratch; as far as I know nobody has ever built new fossil fuelled power stations in order to back up wind. Spain does have standby gas powered generation assets; it is rarely used. To say that new power lines are needed is moot, every power station however powered requires new power lines. The issue of the percentage of power that can be supplied by wind within the system before instability / back up considerations is also shown to be a non problem within the Spanish system, as I say elsewhere fifty percent of the load can be taken by wind on ocassion, thirty to forty percent is common, the record is sixty percent. I do not say that everywhere can have a similar system, I use the Spanish system as an example because the information is readily available and I live here, and I know that the lights stay on here as reliably as anywhere else.
I believe the disparity between the wind energy potential map and your guesstimate comes from overly pessimistic assumption of both:
1. effective collection area: The reason why wind power is economically feasible at all is that you only put turbines in places that naturally concentrate wind energy, meaning you use a very small area to collect energy that was originally deposited by the sun in a much much larger area. This is even more true for the prime locations offshore, where my guess would be that you have hundreds to thousands of km in radius as the effective collection area.
2. and effective collection height: Windmills need to be 10 rotor diameters apart to keep power loss <10%, and that works for the largest windfarms we currently have with many windmills in a row. At 50% efficiency this means that in the distance between two windmills, the power output of a whole windmill (or 50% of the energy in the wind) is almost completely replenished from above! It can't come from insolation on the land area in between, that wouldn't create horizontal movement at all. I don't know how many windmills you can put in a row to still have this work, but current wind farms seem to not have hit that limit yet. So say we put 10 windmills in a row, we must be effectively collecting energy from a total height of about 10 rotor diameters times 50%, let's just say 500m. I may have missed a ^0.5 there, since we are not draining energy from the space in between windmills perpendicular to the wind, and so get part of the replenishing from that. On the other hand, large installations are bigger than just 10 windmills in a row, so I'm sticking to the 500m.
I realize this is exactly the bottom-up approach which you don't like, but the above assumptions still seem to be working for the size of current installations. My guess is that they will stop working at a certain size, so the 17.5 TW is too optimistic. But you really should be using the lower 48 states extended by maybe 1000km out to sea as effective collection area, then use the 500m as effective height, giving about 5x the volume and thus available energy. This makes the disparity <3x, as opposed to almost 15x before, and the truth probably lies somewhere in between.
I just realized that you can put my point 2. in an even shorter form: If windmills need to be seperated by 5 rotors when standing side by side to not affect each other, the same should be true if they were stacked on top of each other. So the windmill must be effectively extracting energy from at least 2.5x its diameter.
Bad math: 5x separation means 5x diameters, not 2.5 (2.5 on each side, yes—adding to 5), but this does not mean extraction happens on this scale: most passes through untouched to be possibly scooped up by the next windmill. I think the 5x separation is considered relevant for a 2-D array, but a single line may be able to pack them much closer without serious negative impact.
Your point 1 is reflected by the non-uniform appearance of the map: some areas are not particularly useful for wind, and other places have concentrated wind.
As to point 2, if windmills are 100 m diameter with a 100 m hub-height (reaching up to 150 m), and spaced 5 rotor diameters apart, then each rotor occupies only 10% of the rectangle allocated to it (150 m by 500 m). Then each rotor extracts only about 50% of the incident wind, so that you could have 20 rows (spanning 20 km at 10 rotor diameters along-wind) without requiring vertical replenishment. Are there wind farms with this many rows? The ones I have seen from airplanes do not come close to this, but that’s not a good global sample. In any case, I don’t swallow your argument that we must get substantial vertical replacement between each row, effectively extending the vertical range by the number of rows employed.
Finally, going 1000 km offshore is not on anyone’s radar: deep water wind is impractical, and discarded from all assessments I have seen. You’re on shaky ground there.
found a nice study about windfarm sizes in europe: http://www.offshore-power.net/Files/Dok/casestudy-europeanoffshorewindfarms.pdf
Large offshore farms are around 10×10 windmills.
Let me clarify my point about rotor sizes and distances: 10 diameters downwind, the windspeed is almost back to what it was before the windmill, even _directly_ downwind. Thus, during this distance, the air which was slowed down because it went directly through the area of the rotor, has been sped up again by being dragged by the surrounding faster-moving airflow. This implies that while the windmill of course only extracts energy directly from airflow hitting the rotor area, if you look far enough downwind it will have slowed down a much larger “tube” of air, but by a much smaller amount. This tube should extend up at least as far as it extends to each side, that’s where the 2.5x came from – we have no airflow underground 😉
And you misunderstood the 1000km, which I really should have clarified in point 1. I did not mean to put windfarms that far out. I meant that – especially at sea – weather systems can be that large, therefore you need to count solar energy incident on those areas as contributing to the energy contained in the wind even near shore.
My initial take away from this is why wind has its uses, ultimately solar seems the preferred method of choice….and since research dollars are scarce it should get the majority of the renewable budget.
While wind blows better at night than solar farms, ultimately storage and transmission is going to be an issue for both technologies, and I’d rather focus on a energy source that could theoretically scale with growing energy use, instead of one that may not be capable (within margins of efficiency) to handle even current need.
“Electric cars are unlikely to penetrate the market quickly and cheaply enough to avert hardship.”
I’m looking forward to the post in which you provide the mathematical underpinning for this statement. To get you started, in 2009 Germany replaced almost 10% of its old cars with new ones. Are you expecting oil imports to Germany to decline by over 10% per year?
I don’t think it’s as simple as this. Electric cars are more expensive, have less range, have long recharge times, and other “features” that dissuade potential buyers. I’m betting that only the tiniest sliver of the 10% German turnover was in electric cars.
But I’m going to keep this discussion focused on wind/solar potential, rather than electric cars…
You said, “If the air velocity is v, each second of time delivers a tube of air with volume Av, where A is the area of the rotor (πD²/4, if D is the rotor diameter). The mass of air incident on the windmill each second is then ρAv, where ρ ≈ 1.2 kg/m³ is the density of air. The kinetic energy available per second, or power, is therefore P = ½ρAv³.”
I’m wondering why the area is that large if the rotors themselves only take up a small fraction of that total area, maybe ~ 5%. The wind is only impinging on the rotors, the rest passes by? What am I missing?
Ah—yes, this is a somewhat subtle issue. The rotor blades act much like airplane wings. An airplane wing in level flight interacts with a very thick swath of air: much thicker than the strict geometrical thickness of the wing. It can be on the scale of the wingspan (or some sizable fraction thereof). So shifting to the windmill point of view, a thick section of the oncoming “tube” senses/interacts-with the blades as they sweep along. The net effect is that windmills capture as much as about 45% of the energy incident on the rotor circular area, even if the blades themselves only occupy a small fraction of that area.
I am a big fan of both wind and solar, and I guess I cannot argue with the numbers that say that fossil fuels are currently the energy source of choice. It seems that the ‘contest’ between wind and solar came out a tie. Depending on which parameter you use, either wind or solar would come out on top.
Great blog Tom. Thank you for writing it.
I am interested in Fresnel lenses and their ability to deliver a lot of concentrated energy. They seem like low-tech, high-value devices that could have a big impact in our energy-starved future. The videos of boiling water, melting metals, and turning stirling engines are impressive. What are your thoughts? Also I just learned that the screen of a rear projection TV is a Fresnel lens, so there are a lot of free ones out there.
So what does Lovelock mean when he says (in The Revenge of Gaia) that ‘already we are discovering that wind farms alter the vorticity of the atmosphere’.
” My earlier estimate of 0.15 W/m² of wind potential, when multiplied by the area of the lower-48 states gives about 1.2 TW. I am left to puzzle over the disparity”.
When you made the calculation of 17 W/m2, you made the following assumption for a 10 km column of air of 1 m2.
“If we instantly sapped all that energy from the air, how long would it take to re-establish the full flow as if nothing had happened? I’m going to say one day, or 86,400 seconds”
Firstly, this assumption seems hard to digest. But assuming the assumption is reasonable, there seems to be a problem in arriving at 0.15 W/m2 which is based on 17 W/m2 and by applied the assumption that wind mill will not be able to tap above 150 m, which leads to 180 kg/m2 which is 1.8 % of 10^4 kg which was based on 10 km column of air. Now if your weight/volume reduced so drastically, then the assumption of the time it takes to instantly remove the energy and replace it should also be reduced. If the troposphere were only 150 m tall, a 1 m2 column of air of this height would require less time to be moved. So it seems the 17 W/m2 will remain 17 W/m2 no matter what height you choose
Undoubtedly there will be vertical mixing, and my simple estimate leaves this out. But it would never be complete mixing. The de Castro et al. work provides a hint at how significant this effect may be: a factor of four boost. Of course, they then offer a number of realistic inefficiencies that I left out, pulling their global total down to 1 TW, which is lower than I got with my simple estimate, even neglecting vertical mixing.
Thanks. Fossil fuels have made us insane when it comes to assuming our energy requirements. We are totally anti-life as we are doing the exact opposite of what life has been doing on the planet – we are increasing entropy instead of decreasing entropy [the net carbon and energy locked in our 7 billion bodies is way lower than what we have increased, a calculation on that may be interesting]. Solar definitely has more potential than other sources, but we need to consider energy to collect solar energy and the sustainability of such “apparatus”, not just storage but actual collection, distribution etc. I forward your blogs to many in the overly optimistic technical community who have zero understanding of these very important problems and continue to live in fantasyland. When you are sort of “done” with your blogs, please consider putting them in a book to reach a wider audience.